Policy Recommendations
- Fiscal Reform the retirement systems of localities to reduce local taxes.
- Regulatory Reform the civil liability system by capping punitive damages, setting the standard for punitive damages at “beyond a reasonable doubt,” and abolishing joint and several liability.
- Personal If serious about reducing smoking, preempt local flavored e-cigarette sales bans and vaping bans in bars and restaurants.
Analysis
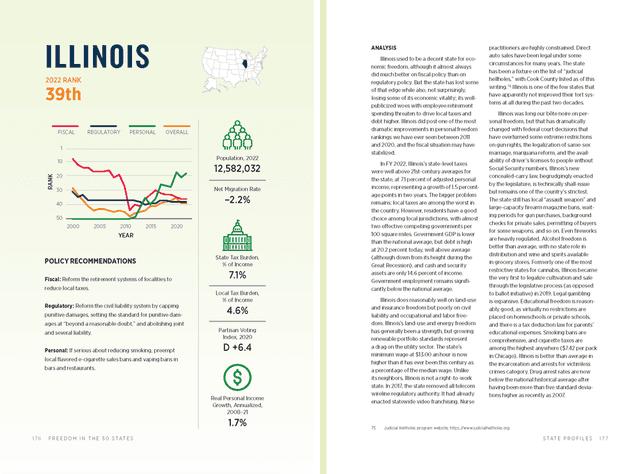
Illinois used to be a decent state for economic freedom, although it almost always did much better on fiscal policy than on regulatory policy. But the state has lost some of that edge while also, not surprisingly, losing some of its economic vitality; its well-publicized woes with employee retirement spending threaten to drive local taxes and debt higher. Illinois did post one of the most dramatic improvements in personal freedom rankings we have ever seen between 2011 and 2020, and the fiscal situation may have stabilized.
In FY 2022, Illinois’s state-level taxes were well above 21st-century averages for the state, at 7.1 percent of adjusted personal income, representing a growth of 1.5 percentage points in two years. The bigger problem remains: local taxes are among the worst in the country. However, residents have a good choice among local jurisdictions, with almost two effective competing governments per 100 square miles. Government GDP is lower than the national average, but debt is high at 20.2 percent today, well above average (although down from its height during the Great Recession), and cash and security assets are only 14.6 percent of income. Government employment remains significantly below the national average.
Illinois does reasonably well on land-use and insurance freedom but poorly on civil liability and occupational and labor freedom. Illinois’s land-use and energy freedom has generally been a strength, but growing renewable portfolio standards represent a drag on the utility sector. The state’s minimum wage at $13.00 an hour is now higher than it has ever been this century as a percentage of the median wage. Unlike its neighbors, Illinois is not a right-to-work state. In 2017, the state removed all telecom wireline regulatory authority. It had already enacted statewide video franchising. Nurse practitioners are highly constrained. Direct auto sales have been legal under some circumstances for many years. The state has been a fixture on the list of “judicial hellholes,” with Cook County listed as of this writing. Illinois is one of the few states that have apparently not improved their tort systems at all during the past two decades.
Illinois was long our bête noire on personal freedom, but that has dramatically changed with federal court decisions that have overturned some extreme restrictions on gun rights, the legalization of same-sex marriage, marijuana reform, and the availability of driver’s licenses to people without Social Security numbers. Illinois’s new concealed-carry law, begrudgingly enacted by the legislature, is technically shall-issue but remains one of the country’s strictest. The state still has local “assault weapon” and large-capacity firearm magazine bans, waiting periods for gun purchases, background checks for private sales, permitting of buyers for some weapons, and so on. Even fireworks are heavily regulated. Alcohol freedom is better than average, with no state role in distribution and wine and spirits available in grocery stores. Formerly one of the most restrictive states for cannabis, Illinois became the very first to legalize cultivation and sale through the legislative process (as opposed to ballot initiative) in 2019. Legal gambling is expansive. Educational freedom is reasonably good, as virtually no restrictions are placed on homeschools or private schools, and there is a tax deduction law for parents’ educational expenses. Smoking bans are comprehensive, and cigarette taxes are among the highest anywhere ($7.42 per pack in Chicago). Illinois is better than average in the incarceration and arrests for victimless crimes category. Drug arrest rates are now below the national historical average after having been more than five standard deviations higher as recently as 2007.