Policy Recommendations
- Fiscal Massachusetts spends more than twice the national average on housing and community development. It also spends above average on public welfare, interest payments, and miscellaneous activities. Cut these areas to pay down debt and build up cash assets.
- Regulatory Repeal outdated and cronyist regulations, such as the price-gouging law, the sales-below-cost laws, moving company licensure, and the certificate-of-need law for hospitals.
- Personal Make the civil asset forfeiture regime consistent with its top criminal justice score by requiring a criminal conviction before forfeiture and banning equitable sharing that does not comply with this standard.
Analysis
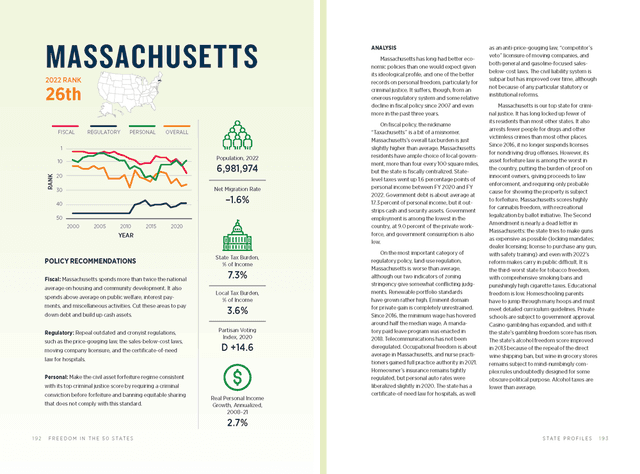
Massachusetts has long had better economic policies than one would expect given its ideological profile, and one of the better records on personal freedom, particularly for criminal justice. It suffers, though, from an onerous regulatory system and some relative decline in fiscal policy since 2007 and even more in the past three years.
On fiscal policy, the nickname “Taxachusetts” is a bit of a misnomer. Massachusetts’s overall tax burden is just slightly higher than average. Massachusetts residents have ample choice of local government, more than four every 100 square miles, but the state is fiscally centralized. State-level taxes went up 1.6 percentage points of personal income between FY 2020 and FY 2022. Government debt is about average at 17.3 percent of personal income, but it outstrips cash and security assets. Government employment is among the lowest in the country, at 9.0 percent of the private workforce, and government consumption is also low.
On the most important category of regulatory policy, land-use regulation, Massachusetts is worse than average, although our two indicators of zoning stringency give somewhat conflicting judgments. Renewable portfolio standards have grown rather high. Eminent domain for private gain is completely unrestrained. Since 2016, the minimum wage has hovered around half the median wage. A mandatory paid leave program was enacted in 2018. Telecommunications has not been deregulated. Occupational freedom is about average in Massachusetts, and nurse practitioners gained full practice authority in 2021. Homeowner’s insurance remains tightly regulated, but personal auto rates were liberalized slightly in 2020. The state has a certificate-of-need law for hospitals, as well as an anti-price-gouging law, “competitor’s veto” licensure of moving companies, and both general and gasoline-focused sales-below-cost laws. The civil liability system is subpar but has improved over time, although not because of any particular statutory or institutional reforms.
Massachusetts is our top state for criminal justice. It has long locked up fewer of its residents than most other states. It also arrests fewer people for drugs and other victimless crimes than most other places. Since 2016, it no longer suspends licenses for nondriving drug offenses. However, its asset forfeiture law is among the worst in the country, putting the burden of proof on innocent owners, giving proceeds to law enforcement, and requiring only probable cause for showing the property is subject to forfeiture. Massachusetts scores highly for cannabis freedom, with recreational legalization by ballot initiative. The Second Amendment is nearly a dead letter in Massachusetts: the state tries to make guns as expensive as possible (locking mandates; dealer licensing; license to purchase any gun, with safety training) and even with 2022’s reform makes carry in public difficult. It is the third-worst state for tobacco freedom, with comprehensive smoking bans and punishingly high cigarette taxes. Educational freedom is low. Homeschooling parents have to jump through many hoops and must meet detailed curriculum guidelines. Private schools are subject to government approval. Casino gambling has expanded, and with it the state’s gambling freedom score has risen. The state’s alcohol freedom score improved in 2013 because of the repeal of the direct wine shipping ban, but wine in grocery stores remains subject to mind-numbingly complex rules undoubtedly designed for some obscure political purpose. Alcohol taxes are lower than average.