Policy Recommendations
- Fiscal Fiscally decentralize by cutting state taxes and grants to local governments.
- Regulatory Enact statewide restrictions on eminent domain.
- Personal Move to shall-issue concealed-carry licensure, which federal courts may require soon anyway.
Analysis
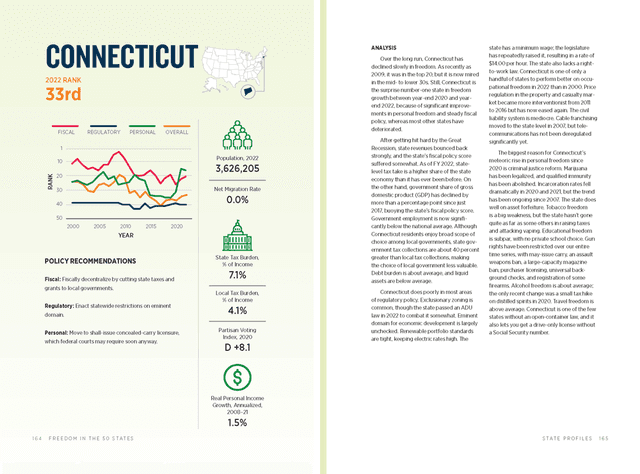
Over the long run, Connecticut has declined slowly in freedom. As recently as 2009, it was in the top 20, but it is now mired in the mid- to lower 30s. Still, Connecticut is the surprise number-one state in freedom growth between year-end 2020 and year-end 2022, because of significant improvements in personal freedom and steady fiscal policy, whereas most other states have deteriorated.
After getting hit hard by the Great Recession, state revenues bounced back strongly, and the state’s fiscal policy score suffered somewhat. As of FY 2022, state-level tax take is a higher share of the state economy than it has ever been before. On the other hand, government share of gross domestic product (GDP) has declined by more than a percentage point since just 2017, buoying the state’s fiscal policy score. Government employment is now significantly below the national average. Although Connecticut residents enjoy broad scope of choice among local governments, state government tax collections are about 40 percent greater than local tax collections, making the choice of local government less valuable. Debt burden is about average, and liquid assets are below average.
Connecticut does poorly in most areas of regulatory policy. Exclusionary zoning is common, though the state passed an ADU law in 2022 to combat it somewhat. Eminent domain for economic development is largely unchecked. Renewable portfolio standards are tight, keeping electric rates high. The state has a minimum wage; the legislature has repeatedly raised it, resulting in a rate of $14.00 per hour. The state also lacks a right-to-work law. Connecticut is one of only a handful of states to perform better on occupational freedom in 2022 than in 2000. Price regulation in the property and casualty market became more interventionist from 2011 to 2016 but has now eased again. The civil liability system is mediocre. Cable franchising moved to the state level in 2007, but telecommunications has not been deregulated significantly yet.
The biggest reason for Connecticut’s meteoric rise in personal freedom since 2020 is criminal justice reform. Marijuana has been legalized, and qualified immunity has been abolished. Incarceration rates fell dramatically in 2020 and 2021, but the trend has been ongoing since 2007. The state does well on asset forfeiture. Tobacco freedom is a big weakness, but the state hasn’t gone quite as far as some others in raising taxes and attacking vaping. Educational freedom is subpar, with no private school choice. Gun rights have been restricted over our entire time series, with may-issue carry, an assault weapons ban, a large-capacity magazine ban, purchaser licensing, universal background checks, and registration of some firearms. Alcohol freedom is about average; the only recent change was a small tax hike on distilled spirits in 2020. Travel freedom is above average. Connecticut is one of the few states without an open-container law, and it also lets you get a drive-only license without a Social Security number.