Policy Recommendations
- Fiscal Local government looks quite inefficient. The state spends far more than the national average on air transportation, sanitation and sewerage, parks and recreation, public buildings, health and hospitals, and interest payments. Cut spending in these areas and cut local taxes.
- Regulatory Relax the state’s extreme land-use regulations. Allow residential uses on land deemed “agricultural,” and eliminate either state or county review, which are duplicative.
- Personal Legalize sale and possession of recreational marijuana.
Analysis
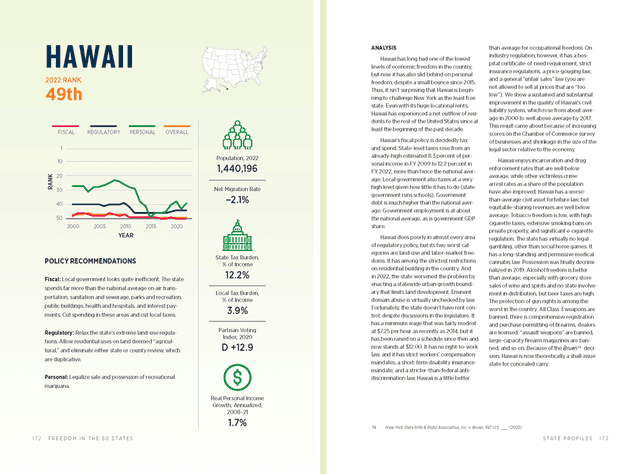
Hawaii has long had one of the lowest levels of economic freedom in the country, but now it has also slid behind on personal freedom, despite a small bounce since 2015. Thus, it isn’t surprising that Hawaii is beginning to challenge New York as the least free state. Even with its huge locational rents, Hawaii has experienced a net outflow of residents to the rest of the United States since at least the beginning of the past decade.
Hawaii’s fiscal policy is decidedly tax and spend. State-level taxes rose from an already-high estimated 8.3 percent of personal income in FY 2009 to 12.2 percent in FY 2022, more than twice the national average. Local government also taxes at a very high level given how little it has to do (state government runs schools). Government debt is much higher than the national average. Government employment is at about the national average, as is government GDP share.
Hawaii does poorly in almost every area of regulatory policy, but its two worst categories are land-use and labor-market freedoms. It has among the strictest restrictions on residential building in the country. And in 2022, the state worsened the problem by enacting a statewide urban growth boundary that limits land development. Eminent domain abuse is virtually unchecked by law. Fortunately, the state doesn’t have rent control, despite discussions in the legislature. It has a minimum wage that was fairly modest at $7.25 per hour as recently as 2014, but it has been raised on a schedule since then and now stands at $12.00. It has no right-to-work law, and it has strict workers’ compensation mandates, a short-term disability insurance mandate, and a stricter-than-federal anti-discrimination law. Hawaii is a little better than average for occupational freedom. On industry regulation, however, it has a hospital certificate-of-need requirement, strict insurance regulations, a price-gouging law, and a general “unfair sales” law (you are not allowed to sell at prices that are “too low”). We show a sustained and substantial improvement in the quality of Hawaii’s civil liability system, which rose from about average in 2000 to well above average by 2017. This result came about because of increasing scores on the Chamber of Commerce survey of businesses and shrinkage in the size of the legal sector relative to the economy.
Hawaii enjoys incarceration and drug enforcement rates that are well below average, while other victimless crime arrest rates as a share of the population have also improved. Hawaii has a worse-than-average civil asset forfeiture law, but equitable-sharing revenues are well below average. Tobacco freedom is low, with high cigarette taxes, extensive smoking bans on private property, and significant e-cigarette regulation. The state has virtually no legal gambling, other than social home games. It has a long-standing and permissive medical cannabis law. Possession was finally decriminalized in 2019. Alcohol freedom is better than average, especially with grocery store sales of wine and spirits and no state involvement in distribution, but beer taxes are high. The protection of gun rights is among the worst in the country. All Class 3 weapons are banned, there is comprehensive registration and purchase permitting of firearms, dealers are licensed, “assault weapons” are banned, large-capacity firearm magazines are banned, and so on. Because of the Bruen decision, Hawaii is now theoretically a shall-issue state for concealed carry.