Policy Recommendations
- Fiscal Cut spending on fire protection, regulatory inspection, air transportation, and parks and recreation. Use the proceeds to trim sales and miscellaneous minor taxes. Nevada spends far more than the national average on police, but that may be warranted given the nature of its social and economic model.
- Regulatory Deregulate occupations such as environmental health specialists, title plant personnel, interior designers, sign language interpreters, clinical laboratory technologists, pharmacy technicians, veterinary technologists, opticians, athletic trainers, massage therapists, landscaping contractors, and well drillers.
- Personal Reap the benefits of school choice by lightening the regulatory burden on private schools: abolish private teacher licensing, state approval, and detailed curriculum requirements.
Analysis
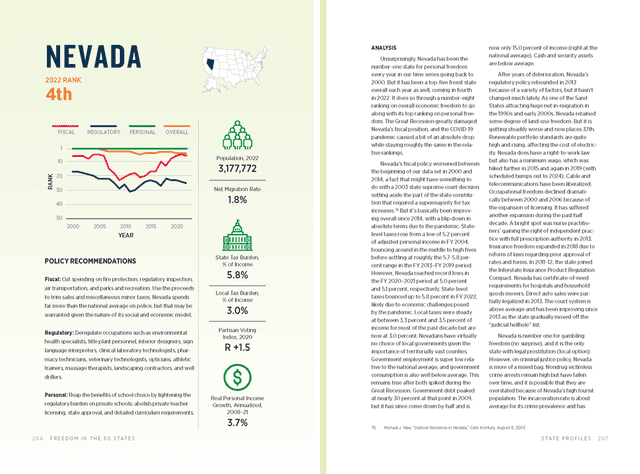
Unsurprisingly, Nevada has been the number-one state for personal freedom every year in our time series going back to 2000. But it has been a top-five freest state overall each year as well, coming in fourth in 2022. It does so through a number-eight ranking on overall economic freedom to go along with its top ranking on personal freedom. The Great Recession greatly damaged Nevada’s fiscal position, and the COVID-19 pandemic caused a bit of an absolute drop while staying roughly the same in the relative rankings.
Nevada’s fiscal policy worsened between the beginning of our data set in 2000 and 2014, a fact that might have something to do with a 2003 state supreme court decision setting aside the part of the state constitution that required a supermajority for tax increases. But it’s basically been improving overall since 2014, with a blip down in absolute terms due to the pandemic. State-level taxes rose from a low of 5.2 percent of adjusted personal income in FY 2004, bouncing around in the middle to high fives before settling at roughly the 5.7-5.8 percent range in the FY 2013–FY 2019 period. However, Nevada reached record lows in the FY 2020–2021 period at 5.0 percent and 5.1 percent, respectively. State-level taxes bounced up to 5.8 percent in FY 2022, likely due to economic challenges posed by the pandemic. Local taxes were steady at between 3.3 percent and 3.5 percent of income for most of the past decade but are now at 3.0 percent. Nevadans have virtually no choice of local governments given the importance of territorially vast counties. Government employment is super low relative to the national average, and government consumption is also well below average. This remains true after both spiked during the Great Recession. Government debt peaked at nearly 30 percent at that point in 2009, but it has since come down by half and is now only 15.0 percent of income (right at the national average). Cash and security assets are below average.
After years of deterioration, Nevada’s regulatory policy rebounded in 2013 because of a variety of factors, but it hasn’t changed much lately. As one of the Sand States attracting huge net in-migration in the 1990s and early 2000s, Nevada retained some degree of land-use freedom. But it is getting steadily worse and now places 37th. Renewable portfolio standards are quite high and rising, affecting the cost of electricity. Nevada does have a right-to-work law but also has a minimum wage, which was hiked further in 2015 and again in 2019 (with scheduled bumps out to 2024). Cable and telecommunications have been liberalized. Occupational freedom declined dramatically between 2000 and 2006 because of the expansion of licensing. It has suffered another expansion during the past half decade. A bright spot was nurse practitioners’ gaining the right of independent practice with full prescription authority in 2013. Insurance freedom expanded in 2018 due to reform of laws regarding prior approval of rates and forms. In 2011–12, the state joined the Interstate Insurance Product Regulation Compact. Nevada has certificate-of-need requirements for hospitals and household goods movers. Direct auto sales were partially legalized in 2013. The court system is above average and has been improving since 2013 as the state gradually moved off the “judicial hellhole” list.
Nevada is number one for gambling freedom (no surprise), and it is the only state with legal prostitution (local option). However, on criminal justice policy, Nevada is more of a mixed bag. Nondrug victimless crime arrests remain high but have fallen over time, and it is possible that they are overstated because of Nevada’s high tourist population. The incarceration rate is about average for its crime prevalence and has been trending in the right direction. Drug arrests are low. The civil asset forfeiture regime is mediocre following a small reform in 2015. Marijuana was legalized in 2016 by initiative, and Nevada is a top state for marijuana freedom. Gun rights are middling relative to other states. Extensive background checks were enacted in 2019. Open carry is extensive, but there is no permitless concealed carry. Nevada is one of the top states for alcohol freedom, with fully private wholesaling and retailing, low taxes, no blue laws, legal direct wine shipping, and wine and spirits in grocery stores. In 2013, the state enacted a law giving illegal immigrants access to driver’s licenses, which outweighs its 2011 move to ban handheld cell phone use in increasing overall travel freedom. Nevada is middling on educational freedom. Private schools are tightly regulated, facing mandatory state approval, mandatory teacher licensing, and detailed private school curriculum control. However, the state has a broad tax-credit scholarship, enacted in 2015. Even tobacco is not as tightly controlled as one would expect from a state with the ballot initiative, although taxes were raised significantly in 2015. Nevadans may still light up in bars with permission of the owner.