Policy Recommendations
- Fiscal Trim spending in areas noticeably above national averages, such as housing and community development, fire protection, public buildings, parks and recreation, and sanitation. Cut local property taxes.
- Regulatory End rent control.
- Personal Allow sales of wine and spirits in grocery stores statewide.
Analysis
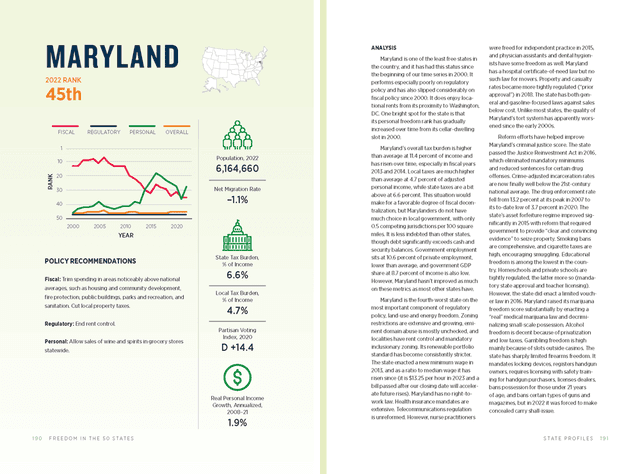
Maryland is one of the least free states in the country, and it has had this status since the beginning of our time series in 2000. It performs especially poorly on regulatory policy and has also slipped considerably on fiscal policy since 2000. It does enjoy locational rents from its proximity to Washington, DC. One bright spot for the state is that its personal freedom rank has gradually increased over time from its cellar-dwelling slot in 2000.
Maryland’s overall tax burden is higher than average at 11.4 percent of income and has risen over time, especially in fiscal years 2013 and 2014. Local taxes are much higher than average at 4.7 percent of adjusted personal income, while state taxes are a bit above at 6.6 percent. This situation would make for a favorable degree of fiscal decentralization, but Marylanders do not have much choice in local government, with only 0.5 competing jurisdictions per 100 square miles. It is less indebted than other states, though debt significantly exceeds cash and security balances. Government employment sits at 10.6 percent of private employment, lower than average, and government GDP share at 8.7 percent of income is also low. However, Maryland hasn’t improved as much on these metrics as most other states have.
Maryland is the fourth-worst state on the most important component of regulatory policy, land-use and energy freedom. Zoning restrictions are extensive and growing, eminent domain abuse is mostly unchecked, and localities have rent control and mandatory inclusionary zoning. Its renewable portfolio standard has become consistently stricter. The state enacted a new minimum wage in 2013, and as a ratio to median wage it has risen since (it is $13.25 per hour in 2023 and a bill passed after our closing date will accelerate future rises). Maryland has no right-to-work law. Health insurance mandates are extensive. Telecommunications regulation is unreformed. However, nurse practitioners were freed for independent practice in 2015, and physician assistants and dental hygienists have some freedom as well. Maryland has a hospital certificate-of-need law but no such law for movers. Property and casualty rates became more tightly regulated (“prior approval”) in 2018. The state has both general and gasoline-focused laws against sales below cost. Unlike most states, the quality of Maryland’s tort system has apparently worsened since the early 2000s.
Reform efforts have helped improve Maryland’s criminal justice score. The state passed the Justice Reinvestment Act in 2016, which eliminated mandatory minimums and reduced sentences for certain drug offenses. Crime-adjusted incarceration rates are now finally well below the 21st-century national average. The drug enforcement rate fell from 13.2 percent at its peak in 2007 to its to-date low of 3.7 percent in 2020. The state’s asset forfeiture regime improved significantly in 2015 with reform that required government to provide “clear and convincing evidence” to seize property. Smoking bans are comprehensive, and cigarette taxes are high, encouraging smuggling. Educational freedom is among the lowest in the country. Homeschools and private schools are tightly regulated, the latter more so (mandatory state approval and teacher licensing). However, the state did enact a limited voucher law in 2016. Maryland raised its marijuana freedom score substantially by enacting a “real” medical marijuana law and decriminalizing small-scale possession. Alcohol freedom is decent because of privatization and low taxes. Gambling freedom is high mainly because of slots outside casinos. The state has sharply limited firearms freedom. It mandates locking devices, registers handgun owners, requires licensing with safety training for handgun purchasers, licenses dealers, bans possession for those under 21 years of age, and bans certain types of guns and magazines, but in 2022 it was forced to make concealed carry shall-issue.