Policy Recommendations
- Fiscal Local governments need to get a handle on school spending and taxes. State government may be able to help by moving town meetings and local elections to coincide with state elections, boosting turnout and diluting the political power of insiders, or by adopting the Virginia model of off-year elections for state and local offices.
- Regulatory Pass a right-to-work law that is consistent with free association, as described in Part 1.
- Personal Enact universal school choice to avoid falling behind on educational freedom given how proactive other states have been.
Analysis
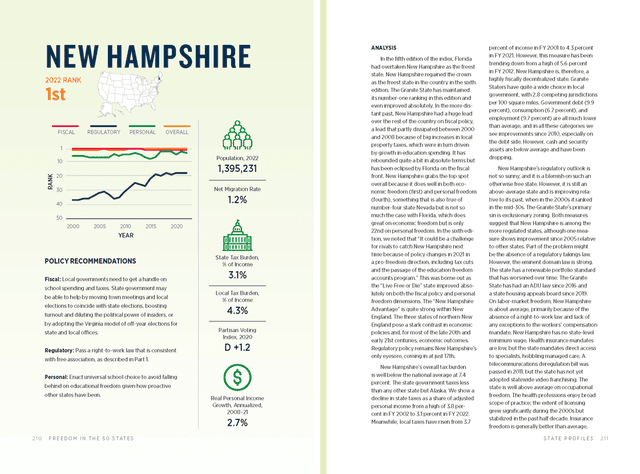
In the fifth edition of the index, Florida had overtaken New Hampshire as the freest state. New Hampshire regained the crown as the freest state in the country in the sixth edition. The Granite State has maintained its number-one ranking in this edition and even improved absolutely. In the more distant past, New Hampshire had a huge lead over the rest of the country on fiscal policy, a lead that partly dissipated between 2000 and 2008 because of big increases in local property taxes, which were in turn driven by growth in education spending. It has rebounded quite a bit in absolute terms but has been eclipsed by Florida on the fiscal front. New Hampshire grabs the top spot overall because it does well in both economic freedom (first) and personal freedom (fourth), something that is also true of number-four state Nevada but is not so much the case with Florida, which does great on economic freedom but is only 22nd on personal freedom. In the sixth edition, we noted that “It could be a challenge for rivals to catch New Hampshire next time because of policy changes in 2021 in a pro-freedom direction, including tax cuts and the passage of the education freedom accounts program.” This was borne out as the “Live Free or Die” state improved absolutely on both the fiscal policy and personal freedom dimensions. The “New Hampshire Advantage” is quite strong within New England. The three states of northern New England pose a stark contrast in economic policies and, for most of the late 20th and early 21st centuries, economic outcomes. Regulatory policy remains New Hampshire’s only eyesore, coming in at just 17th.
New Hampshire’s overall tax burden is well below the national average at 7.4 percent. The state government taxes less than any other state but Alaska. We show a decline in state taxes as a share of adjusted personal income from a high of 3.8 percent in FY 2002 to 3.1 percent in FY 2022. Meanwhile, local taxes have risen from 3.7 percent of income in FY 2001 to 4.3 percent in FY 2021. However, this measure has been trending down from a high of 5.6 percent in FY 2012. New Hampshire is, therefore, a highly fiscally decentralized state. Granite Staters have quite a wide choice in local government, with 2.8 competing jurisdictions per 100 square miles. Government debt (9.9 percent), consumption (6.7 percent), and employment (9.7 percent) are all much lower than average, and in all these categories we see improvements since 2010, especially on the debt side. However, cash and security assets are below average and have been dropping.
New Hampshire’s regulatory outlook is not so sunny, and it is a blemish on such an otherwise free state. However, it is still an above-average state and is improving relative to its past, when in the 2000s it ranked in the mid-30s. The Granite State’s primary sin is exclusionary zoning. Both measures suggest that New Hampshire is among the more regulated states, although one measure shows improvement since 2005 relative to other states. Part of the problem might be the absence of a regulatory takings law. However, the eminent domain law is strong. The state has a renewable portfolio standard that has worsened over time. The Granite State has had an ADU law since 2016 and a state housing appeals board since 2019. On labor-market freedom, New Hampshire is about average, primarily because of the absence of a right-to-work law and lack of any exceptions to the workers’ compensation mandate. New Hampshire has no state-level minimum wage. Health insurance mandates are low, but the state mandates direct access to specialists, hobbling managed care. A telecommunications deregulation bill was passed in 2011, but the state has not yet adopted statewide video franchising. The state is well above average on occupational freedom. The health professions enjoy broad scope of practice; the extent of licensing grew significantly during the 2000s but stabilized in the past half decade. Insurance freedom is generally better than average, except for some rate classification prohibitions. The hospital certificate-of-need law was abolished in 2011–12, but that only became effective in 2016. Household goods movers are no longer licensed as of 2022. There are no price-gouging or sales-below-cost laws. New Hampshire is one of the least cronyist states. The state’s civil liability system is far above the national average; punitive damages were abolished long ago. In fact, it comes in first on lawsuit freedom.
New Hampshire is quite personally free. Incarceration rates are extremely low but rose significantly around 2011, only to get better again, really diving during the COVID-19 pandemic. Drug arrest rates are also low but had moved up during 2011–16 before falling again. Nondrug victimless crime arrests are down substantially after being only about average for years. The state enacted a significant asset forfeiture reform in 2016 and is a top-half state. Tobacco freedom is below average, as taxes are fairly high and smoking bans are extensive. The state now has a limited anti-vaping law. Educational freedom is extensive in the Granite State, earning it a number-two position in the rankings. New Hampshire’s score was helped by the 2021 passage of an expanded ESA program. A liberal tax-credit scholarship law was enacted in 2012 and a local-option voucher law in 2018, raising the state significantly above average on educational freedom even though compulsory schooling lasts 12 years, and private schools require state approval. New Hampshire has charitable gambling and legal internet sports betting, but it still scores well below average in the gambling freedom category. Cannabis freedom is above average, helped by the 2017 decriminalization law but dragged down by an inability to fully legalize. Alcohol freedom is lagging; the state monopolizes liquor retail and wine wholesale, but the effective tax rate is extremely low. Wine (but not spirits) is sold in grocery stores. It is one of the two best states in the country for gun rights. The constitutional carry bill enacted in 2017 helped here. New Hampshire has neither a seat belt law nor a motorcycle helmet law.