Policy Recommendations
- Fiscal Cut spending on higher education, employment and security administration, health, and sewerage, which is much higher than average. Use the proceeds to reduce income and property taxes.
- Regulatory Allow full nurse practitioner independent practice and prescription authority, and join the Nurse Licensure Compact.
- Personal Enact a liberal tax-credit scholarship or education savings account program for private education.
Analysis
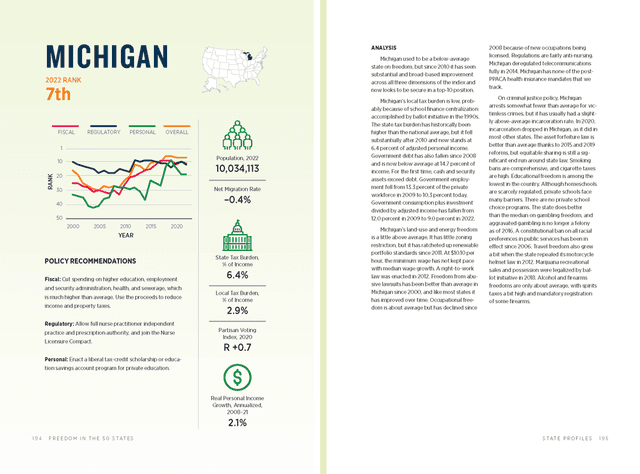
Michigan used to be a below-average state on freedom, but since 2010 it has seen substantial and broad-based improvement across all three dimensions of the index and now looks to be secure in a top-10 position.
Michigan’s local tax burden is low, probably because of school finance centralization accomplished by ballot initiative in the 1990s. The state tax burden has historically been higher than the national average, but it fell substantially after 2010 and now stands at 6.4 percent of adjusted personal income. Government debt has also fallen since 2008 and is now below average at 14.7 percent of income. For the first time, cash and security assets exceed debt. Government employment fell from 13.3 percent of the private workforce in 2009 to 10.3 percent today. Government consumption plus investment divided by adjusted income has fallen from 12.0 percent in 2009 to 9.0 percent in 2022.
Michigan’s land-use and energy freedom is a little above average. It has little zoning restriction, but it has ratcheted up renewable portfolio standards since 2011. At $10.10 per hour, the minimum wage has not kept pace with median wage growth. A right-to-work law was enacted in 2012. Freedom from abusive lawsuits has been better than average in Michigan since 2000, and like most states it has improved over time. Occupational freedom is about average but has declined since 2008 because of new occupations being licensed. Regulations are fairly anti-nursing. Michigan deregulated telecommunications fully in 2014. Michigan has none of the post-PPACA health insurance mandates that we track.
On criminal justice policy, Michigan arrests somewhat fewer than average for victimless crimes, but it has usually had a slightly above-average incarceration rate. In 2020, incarceration dropped in Michigan, as it did in most other states. The asset forfeiture law is better than average thanks to 2015 and 2019 reforms, but equitable sharing is still a significant end run around state law. Smoking bans are comprehensive, and cigarette taxes are high. Educational freedom is among the lowest in the country. Although homeschools are scarcely regulated, private schools face many barriers. There are no private school choice programs. The state does better than the median on gambling freedom, and aggravated gambling is no longer a felony as of 2016. A constitutional ban on all racial preferences in public services has been in effect since 2006. Travel freedom also grew a bit when the state repealed its motorcycle helmet law in 2012. Marijuana recreational sales and possession were legalized by ballot initiative in 2018. Alcohol and firearms freedoms are only about average, with spirits taxes a bit high and mandatory registration of some firearms.